How to Bring Down a Kubernetes Control Plane with a Single YAML
Kubernetes is a popular container orchestration platform used by developers to manage large-scale applications. At its core is the control plane, which handles the management and communication of the various components that make up a cluster. However, like any complex software system, kubernetes is not immune to bugs and vulnerabilities.
In this blog post, we’ll dive into a particularly nasty bug in the kubernetes controller manager that affects version <= 1.26.3 and can bring down the entire control plane with a single YAML file.
To understand the gravity of this issue, it’s important to know that a control plane outage can have serious consequences for those who rely on kubernetes for their infrastructure and applications. Without a functioning control plane, developers are unable to manage or deploy their workloads, which can lead to costly downtime and lost revenue. Despite the severity of this bug, as of the time of writing this article, none of the major cloud providers have addressed the issue by itself and rely on the user’s platform teams to mitigate it.
In the following sections, we’ll explore the specifics of the kubernetes controller bug and provide guidance on how to mitigate the risk of a control plane outage.
TL;DR
The Kubernetes controller bug we’ll be discussing in this post allows for an infinite loop of pod creation, ultimately causing the API server to become unresponsive. This can be triggered by applying a k8s deployment manifest with a large payload and enforcing a fail state in the pod, leading to a continuous cycle of pod creation. In this post, we’ll go into further detail on how this bug works and how to prevent it from bringing down the kubernetes control plane.

Deep dive
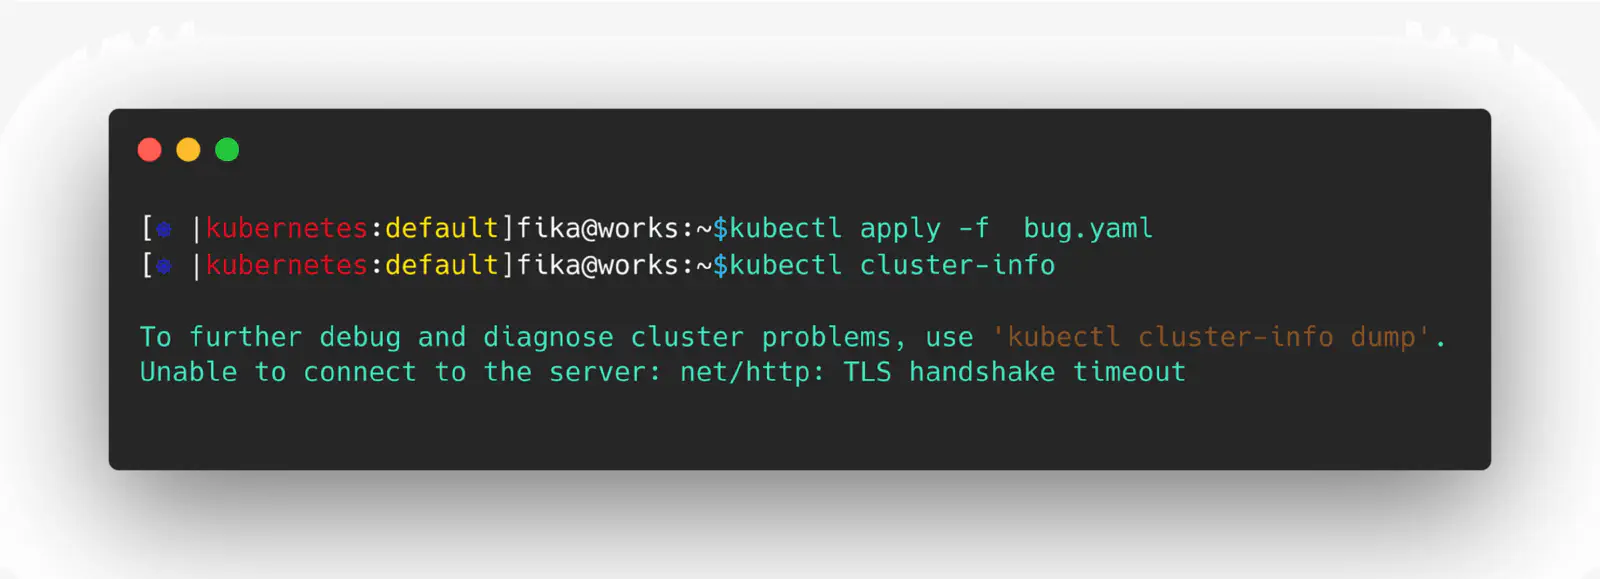
As shown in the GIF above, applying a malicious manifest to the API server triggers an infinite loop of pod creation. Let’s take a closer look at the malicious manifest itself.

Upon inspection, you’ll notice that its payload is intentionally large, capable of reaching up to 1.5MiB (depending on the etcd system limits), and it sets an unsafe sysctl ( https://kubernetes.io/docs/tasks/administer-cluster/sysctl-cluster/#safe-and-unsafe-sysctls ). Because the kubelet is not configured to support this specific unsafe sysctl, it marks the pod as failed and triggers the bug.
The large payload and unsafe sysctl settings generate high pressure on the etcd and API server, as well as on any controllers that are watching pods (such as kubelet and CoreDNS). As a result, it’s only a matter of time before the system’s OOM (Out Of Memory) manager kills one or more of these components, ultimately bringing down the entire control plane.
So what’s the underlying cause of this behavior in Kubernetes? The culprit lies in the Kubernetes controller-manager, specifically in the ReplicaSet controller, which is one of its many controllers. When we run the command kubectl apply -f deployment.yaml, the persisted deployment resource goes through a series of controllers, each performing a different translation.

First, the deployment is translated into ReplicaSets. Then, the ReplicaSet controller translates its definition into pods. Once the pods are created, the scheduler controller determines where the pods should be deployed. Finally, another controller - kubelet ensures that the pod is created on the target node and updates its status with the result.
Code analysis
Let’s take a closer look at the code to understand what happens when a pod status result is marked as “failed”. In the main sync loop of the ReplicaSet controller ( https://github.com/kubernetes/kubernetes/blob/v1.26.3/pkg/controller/replicaset/replica_set.go#L658-L723 ), every time a ReplicaSet sync event is received, it lists all the pods that belong to the ReplicaSet in question and filters them for active ones. The active pods are those that are not deleted (deletionTimestamp is nil) and are not in the “Failed” or “Succeeded” phase, according to Kubernetes documentation:
- “Succeeded” means that all containers in the pod have voluntarily terminated with a container exit code of 0, and the system is not going to restart any of these containers.
- “Failed” means that all containers in the pod have terminated, and at least one container has terminated in a failure (exited with a non-zero exit code or was stopped by the system).
As a result, since created pod with unsafe sysctl is marked as failed, the list of active pods is empty, and it is passed to the next function, which is responsible for managing and adjusting pod replicas ( https://github.com/kubernetes/kubernetes/blob/v1.26.3/pkg/controller/replicaset/replica_set.go#L553-L653 ). Since the difference between the active and expected number of pods is always negative (0 - <replicas number in the deployment>) ( https://github.com/kubernetes/kubernetes/blob/v1.26.3/pkg/controller/replicaset/replica_set.go#L554 ), the pods will be created at every iteration of the sync loop.
You might be wondering why we don’t observe this behavior for “CrashLoopBackoff”
or “ImagePullBackoff” errors. That’s because their corresponding phases are
“Pending” and “Running”, respectively, so they will always be included in the
list of active pods.
While it is fortunate that inducing pods to enter a failed state through the
replicaset controller is not easy, there are still some ways to do so. For more
information on these methods, please refer to the links in the references
section.
Managed kubernetes
Even managed Kubernetes services such as AKS and GKE are susceptible to this issue. During research for this blog post, I was able to bring down control planes for both AKS and GKE. Neither of these services comes with default safety mechanisms to prevent a DOS attack on the control plane, and after running this bug for a prolonged period, the control planes started timing out and eventually became unusable. Although they eventually recovered, it’s likely that their backing etcd instances scaled up and were able to perform a successful compaction. Nonetheless, the downtime was noticeable and unacceptable for production environments.
Unfortunately, I didn’t have a chance to run this bug against EKS. If you’re feeling adventurous and have an EKS instance in your development environment, I encourage you to give this bug a try and let me know your results! Just be sure to keep it isolated from your production environment.
Mitigation
To mitigate this bug, one possible solution is to use ResourceQuotas to set a limit on the number of pods that can be created in the cluster. However, it’s important to note that simply setting a limit on the number of running pods is not enough, as the ResourceQuota must be applied to the count of the actual pod objects in the storage (etcd). This can be done using the count statement in the ResourceQuota definition (see https://kubernetes.io/docs/concepts/policy/resource-quotas/#object-count-quota for more details). By properly configuring ResourceQuotas, you can ensure that the cluster won’t be overwhelmed with too many pods, thus avoiding potential downtime or performance issues.

In addition to setting a limit on the number of pods, it is equally important to ensure that the Kubernetes resources being deployed by the platform’s users are thoroughly audited to prevent situations like this from occurring. This can be done by implementing GitOps practices, where kubernetes resources are first reviewed and approved before they are deployed to the cluster.
However, in the event that a malicious workload does make it through and is deployed in the cluster, it’s important to have admission webhooks such as opa-gatekeeper ( https://github.com/open-policy-agent/gatekeeper ) in place. Admission webhooks are essentially plugins that can be used to intercept requests to the Kubernetes API server and apply custom validation logic before a resource is persisted in the etcd and consumed by controllers.
Opa-gatekeeper is an open-source admission webhook that allows policies to be defined and enforced for Kubernetes resources.
To effectively use opa-gatekeeper, it’s important to have clear policies and boundaries defined by the platform team on what users are allowed to deploy. This can be a large topic and is a good candidate for a future blog post.
Conclusion
To maintain a healthy and secure Kubernetes cluster, it is important to properly manage and audit the resources being deployed. GitOps practices can help ensure that only validated resources are deployed, while admission webhooks like opa-gatekeeper can prevent malicious workloads from being persisted in the etcd and consumed by operators and controllers. However, it ultimately falls on the platform team to set proper boundaries and policies to guide users in their deployments and prevent potential vulnerabilities. By taking these measures, the platform team can help ensure the reliability and security of the Kubernetes cluster.